Welcome to the official blog of the
Verlust der Nacht (Loss of the Night) app and citizen science project! Our intent for this blog is to allow communication and coordination between the app's users from around the world and the scientists who are behind the app's development. The goal of the project is to produce a time series of night sky brightness measurements for inhabited areas all over the Earth, using the human eye as a sensor. In this post, I'd like to explain what skyglow is, and how and why the app was developed.
Skyglow
Most of the readers of this blog aren't able to see the Milky Way from where they live. Waste light from cities scatters in the atmosphere, and makes the sky brighter. As cities produce more and more waste light, this skyglow first outshines dim stars, next the Milky Way, and finally fairly bright stars, until all that can be seen in the night sky are the very brightest of stars, planets, and the moon. This effect can be seen in the photo above, where increased skyglow prevents the camera from seeing as many stars.
Skyglow has been problem for professional astronomers for over a century. Observatories located in cities were abandoned in favor of more rural locations, and eventually for remote locations on mountaintops and in deserts. As cities have become ever brighter, concern has grown about the effects that this light may be having on ecosystems. The ecological problem is magnified on cloudy nights, when the clouds trap the light near the Earth's surface.
Measuring Skyglow
Professional astronomers began the first campaigns to quantify skyglow using scientific instruments in the 1960s. These campaigns have continued, and in a few locations, spectrometers now make precise observations of skyglow on a nightly basis. This information has been very useful for the development of skyglow models, which aim to predict how bright the night sky is anywhere on Earth. Of course, not all areas use the same lighting technology, as can be seen in the image of Berlin below. This means that model predictions need to be tested against data from around the world.
Citizen Science
Citizen science is an ideal technique for solving the problem of measuring the brightness of skyglow around the world, because wherever there is skyglow, there are people. Some amateur astronomers purchase
Sky Quality Meters or other devices like the
International Year of Astronomy Lightmeter to make quantitative measurements of sky brightness. But it's also possible to make use of the fact that skyglow obscures the stars to measure it! In the ideal scenario, if you can figure out which is the dimmest star you can see, then you know how much artifial light there is.
The Internet has allowed citizen scientists to bring all of their observations together in one place. Campaigns like
How Many Stars, GLOBE at Night, and others ask citizen scientists to compare their view of specific constellations to star charts that are provided by the campaign. Examples of three star charts from GLOBE at Night are shown below.
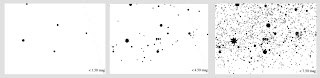 |
| GLOBE at Night star charts for Orion (from the webapp). |
One of the difficulties of these techniques is that if there are very few stars in the sky, for example in the leftmost image above, then it's hard for most of us to know whether we are looking in the right place. Despite this difficulty, we recently demonstrated that *on average*,
GLOBE at Night observations are very strongly related to the local level of skyglow. (We published these results in an open access paper, so that anyone who's interested can read about it for
free!)
Skyglow Apps
In 2012, the
German Federal Ministry of Education and Research provided financing for the
Verlust der Nacht research collaboration to develop a skyglow app. We decided to take advantage of the smartphone to hopefully improve on the technique of the older citizen science projects in badly polluted areas. The
Loss of the Night app for Android phones is based upon Google's
SkyMap app, and asks users to search for a specific star in the sky. If they can see it, then it asks them to find a dimmer star. If they can't, then it asks them to look for a brighter star. By doing multiple observations we eventually work out what the boundary is between visible and invisible stars, the so-called "Naked Eye Limiting Magnitude", which is very closely related to the level of skyglow.
The Loss of the Night app is designed specifically for URBAN ASTRONOMY, and won't work properly in really dark areas. This is both because the smartphone screen will begin to blind you in dark areas, and also because when there are thousands of stars in the sky, it's too hard to tell which one we're asking you to look for. Because different stars are in the sky at different times of the year, it's extremely helpful to us if people use the app from the same locations regularly.
While we were developing the Loss of the Night app, DDQ developed a skyglow app for iOS devices. The
Dark Sky Meter app works by using the device's camera to measure how bright the night sky is. By coincidence, both apps were released within a week of each other in April, 2013. Although it's only been a matter of months, both apps have been installed on thousands of phones, and have been used around the world! Almost 3500 of the locations where the Loss of the Night app has been used are shown below. Red points show every location, black points show the 470 "perfect" observations, where there was no twilight, the moon was set, there were no clouds, and the user observed at least 7 stars.
Does this mean that the older citizen science techniques are outdated?
Most certainly not! For one thing, one of the most important goals of these projects is to develop a stable, long-term time series of skyglow observations. It would be a tradgedy if any of these projects were abandoned! For another, many people do not have access to or interest in using a smartphone, and these people should continue to participate via GLOBE at Night or How Many Stars? Even if you prefer using an app, you can help us cross-correlate the measurements by participating in two or more projects on the same night!
What about satellites?
Satellites have been observing the Earth at night for decades, but until very recently they had very poor spatial and radiance resolution. A new instrument called VIIRS is providing very exciting new data, as you can see in
NASA's "Black Marble" video. There are unfortunately two difficulties with satellite observations of Earth. First, since they look down, they tell us about how bright the ground is, rather than how bright the sky is. Second, VIIRS is not very sensitive to blue light, and the most widely available LED street lamp technology typically includes
a lot of blue in the spectrum.
What is this blog for?
We hope that operating this blog will allow us to build a community of users that can help promote sky brightness observation projects, and hopefully (in the long run) to help us improve our app. In a future post, we'll ask you for ideas of how to improve the app, but we'll have to attract funding for the project before that will be possible!
We also hope to hold "flashmob for science" events, where 100 people will come together in the same location to all observe the same sky at the same time. These events will be extremely important for us to understand the variation in how different people and different phones respond to the exact same night sky.
What can I do to help today?
- Spread word about the app and other projects via Facebook, twitter, letters to your local newspaper, etc.
- Take sky brightness data whenever you happen to have a good, clear, moon free night.
The next opportunities to use the app (moon-free evenings) are:
August 25 - September 9 (2013)
September 24 - October 9 (2013)
These dates are approximate, and depend on local sunset and moonrise/moonset times.)
- Let us know you like the app in the comments, and rating it 5 stars on the Google Play website!
- Become a member of the International Dark Sky Association, who provide
information on modern environmentally friendly lighting practicies for
cities, companies, and individuals.
- Finally, we are looking for people to translate the app into additional languages. If you are able to, please contact Christopher Kyba.
A note about comments
We will start off with unmoderated comments, but please keep all discussion related as much as possible to the app, and the topic of the blog post.
Constructive criticism about the app is very welcome, but any comments about other users that can possibly be construed as negative will be deleted, as will non-constructive criticism, spam, etc.


